Recon
Use recon to monitor the airspace around you, and display Wi-Fi traffic, packet rates, and discover new access points and devices.
In the Recon screens you can interactively drill down into the wireless environment around you, with detailed information about encryption configurations, client counts, and advanced WiFi behavior of all the devices around you - and then leverage the power of the payload system to run custom actions against clients and access points!
Recon mode
The WiFi Pineapple is always collecting data in the background and categorizing wireless devices and traffic around you.

Select the Recon category from the dashboard
Recon mode introduction
Select the Recon category from the dashboard
Recon mode starts on the packet traffic screen. Immediately, you’ll notice some differences!
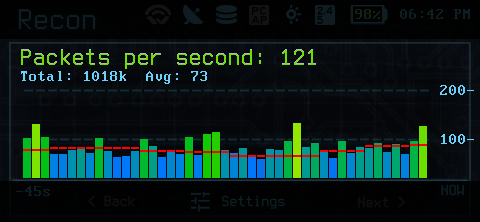
Recon status bar
Recon status bar
In Recon mode, the device status bar is updated to include:
- Wigle Wardrive logging. If you have a USB GPS device connected to your Pager, you can export wardriving data for wigle.net
- GPS status. If you have a USB GPS device connected to your pager, this will indicate if there is a valid GPS position.
- Recon logging status. By default recon data is logged to the persistent recon database for offline processing later.
- PCAP logging status. By default, pcap logging is disabled (pcap logs can grow very large, very quickly!) but if logging is enabled it will be indicated here.
- Brightness. The standard screen brightness indicator.
- Enabled bands. The WiFi Pineapple Pager can monitor WiFi on 2.4GHz (802.11b, 802.11g, some 802.11n networks, and rarely 802.11ax), 5GHz (802.11a, 802.11n, 802.11ac, 802.11ax), and 6GHz (802.11ac and 802.11ax under the Wi-Fi 6e and WiFi 7 names). By default, the Pager monitors 2.4GHz and 5GHz.
- Battery. The standard battery status indicator.
- Time. The standard time indicator.
Main graph view
Recon graph view
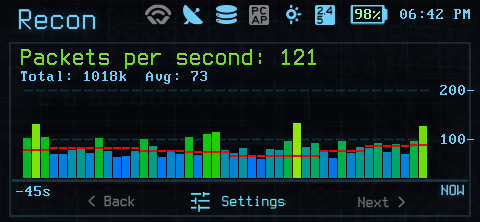
In graph mode, recon displays the current rate of events - packets per second, access points discovered, clients discovered, and so on, as a bar graph.
Additionally, the average CPU load of the device is indicated by the red line on the graph.
The data displayed in the graph can be changed using the left and right buttons on the DPAD.
Graph controls
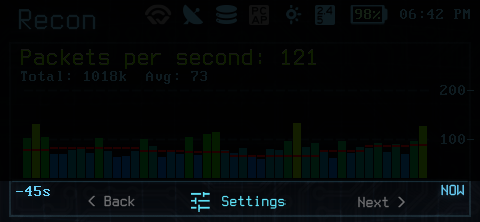
Recon graph controls
Use the left and right buttons on the DPAD to select the graph data. Press the A’ (green) button for additional settings!
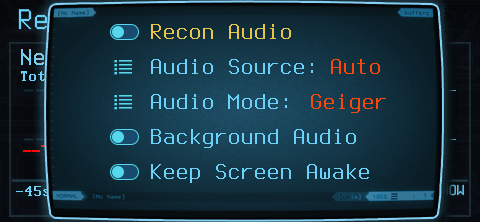
Additional Recon settings

Additional Recon settings
The settings menu gives additional control over recon behavior. Be sure to try out the audio modes!
The settings menu also exposes control of the Wi-Fi channels monitored:
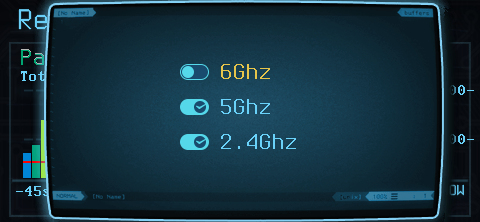
Additional Recon settings
Recon device lists
Recon device lists
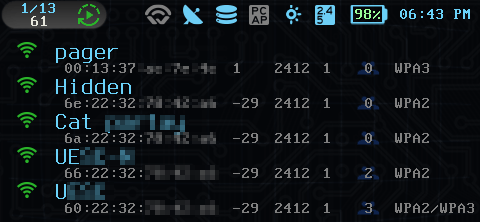
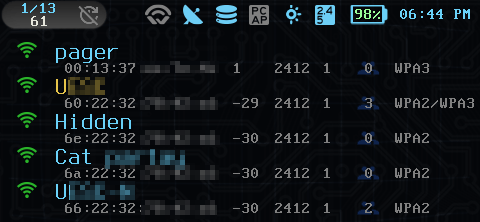
Scrolling past the Recon graphs reveals the Recon device view. This view shows you you the detected wireless devices and clients.
Recon device summary
In the top left of the Recon Device list, you will find the list summary, showing the total number of devices and the current view page. Next to these is the update indicator - by default the list is in auto update mode, showing the latest information about the five most recent and strongest wireless devices.
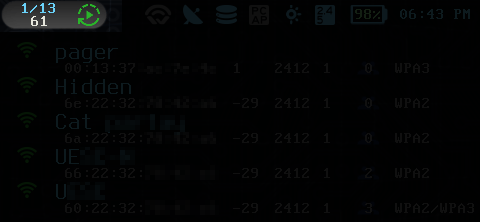
Using the up and down arrows on the DPAD will pause the list, allowing you to scroll through all devices and interact with them.
Recon device summary
When scrolling through a list, the refresh icon indicates that updates are frozen, and the currently selected device is highlighted.
Pressing the ‘A’ button (green) on a device opens the device details display.
The list can be un-paused by using the up arrow on the DPAD until the refresh icon is selected and pressing the ‘A’ (green) button, or by jumping directly to the refresh icon by hitting the ‘B’ (red) button and then selecting it with ‘A’.
Did you know?
You can use the right and left buttons on the DPAD to scroll through the recon device list faster!
Device details
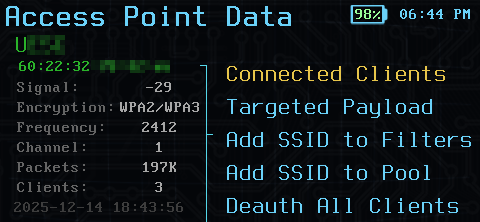
Access point details
The device details display shows additional details about a device, advertised SSIDs, encryption types, signal levels, packet counts, connected clients, and more.
The details display is where you view detailed clients lists, interactively control the PineAP filter and advertising behavior for impersonating Open access points (see the PineAP section of the documentation for more on this!), run custom payloads, and perform deauthentication attacks.
Client details
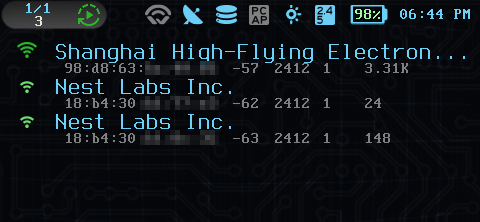
Client list
The Client List display works the same way as the Access Point list, showing all the clients observed on an access point.
Remember - an access point does not simply advertise what clients are connected. For the WiFi Pineapple to associate a client with an access point, it must observe that client generating traffic.
Successfully observing a client means the client must be generating packets at the time that the WiFi Pineapple is monitoring that specific channel. It may take some time monitoring the area to detect all clients.
Check out the PineAP and Introduction to Wi-Fi documentation for more information!
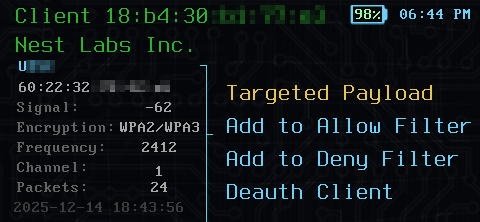
Client details
The client details display offers a similar suite of options to the network display.