Dashboard
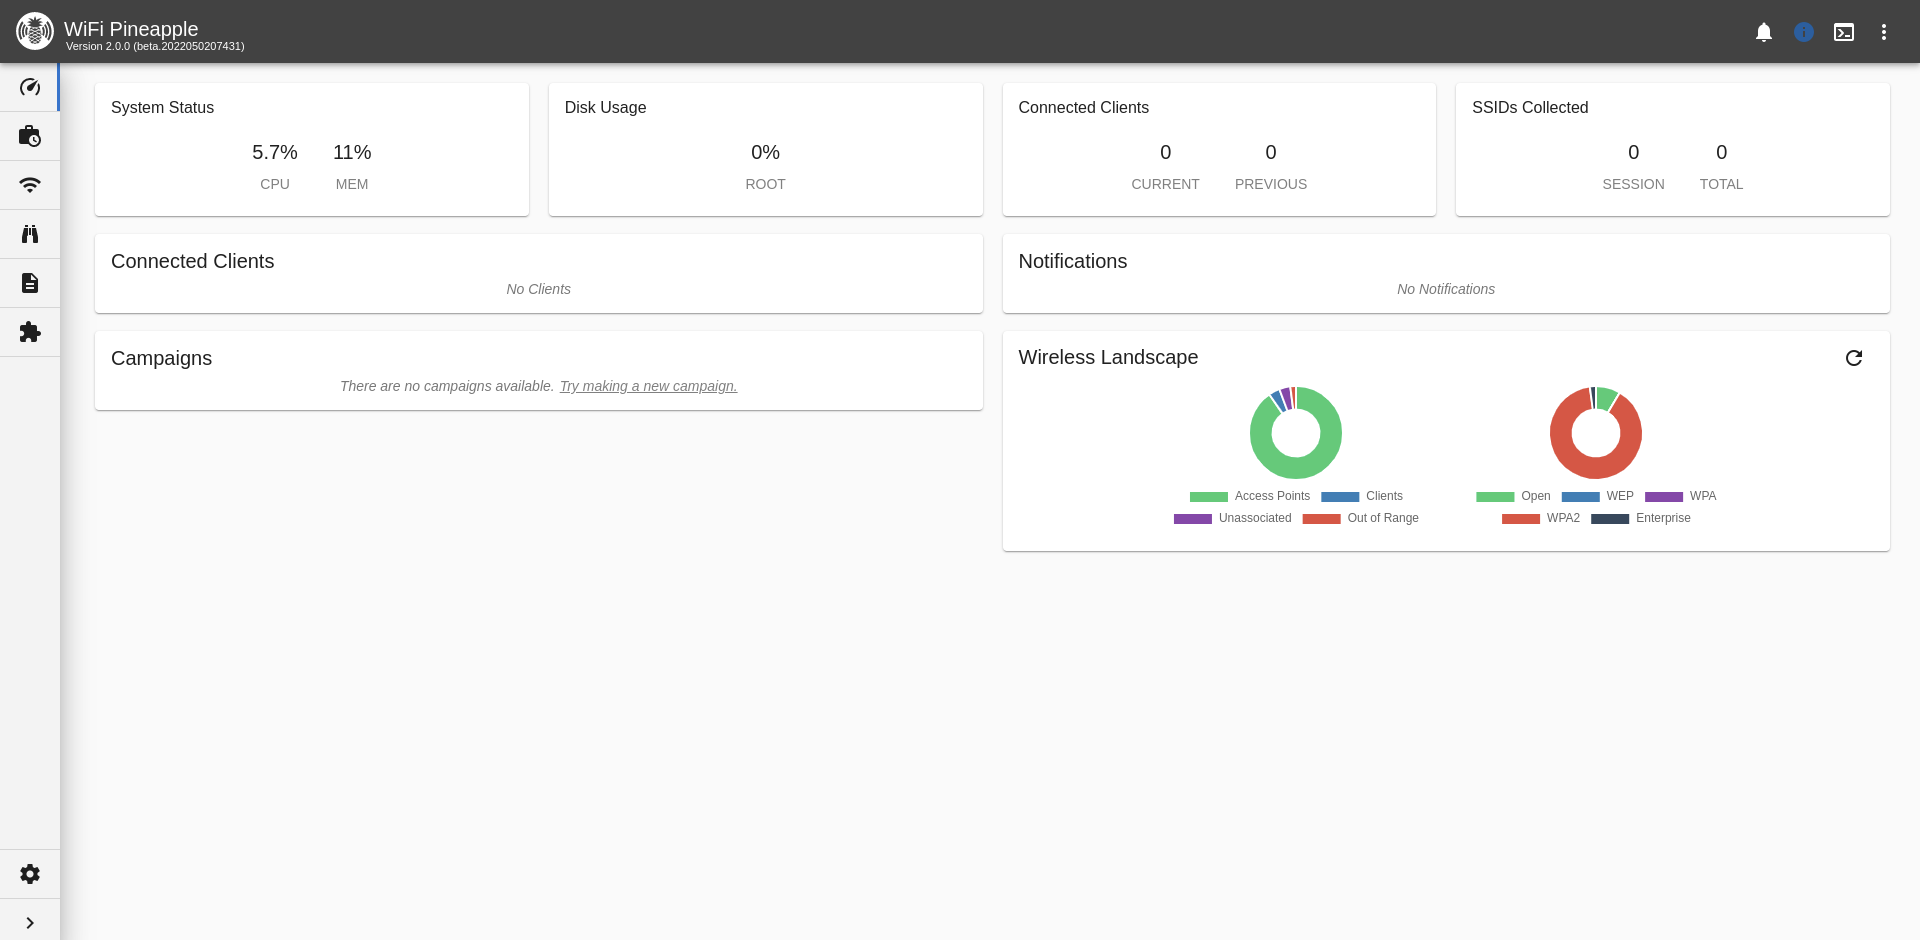
The WiFi Pineapple UI Dashboard shows an at-a-glance status of some of the components of the device.

WiFi Pineapple Dashboard
Cards
Along the top of the page, multiple cards show different system status numbers, such as CPU and RAM usage, Disk usage and Client Stats. These stats automatically update when viewing the Dashboard.
Connected Clients
MAC Address, IP Address and Connected Time can be viewed for all clients connected to non-Management access points. You can also kick a specific client by using the Kick button.
Some clients may automatically reconnect quickly. Clients can be denied association via the PineAP Filters.
Notifications
Notifications are a way for the system or modules to indicate a change in status or other message. They can have one of 5 notification levels: Info, Warning, Error, Success or Unknown.
Campaigns
The campaign status, name and type show a brief description of current campaigns, along with a toggle button to enable or disable them.
Wireless Landscape
Brief statistics from the latest Recon scan provide an at-a-glance view without having to dive into details of the scan.